NEUROCUB >> PATIENT REPORTING & CLINICAL DASHBOARD
Structured Clinical Therapy Reports

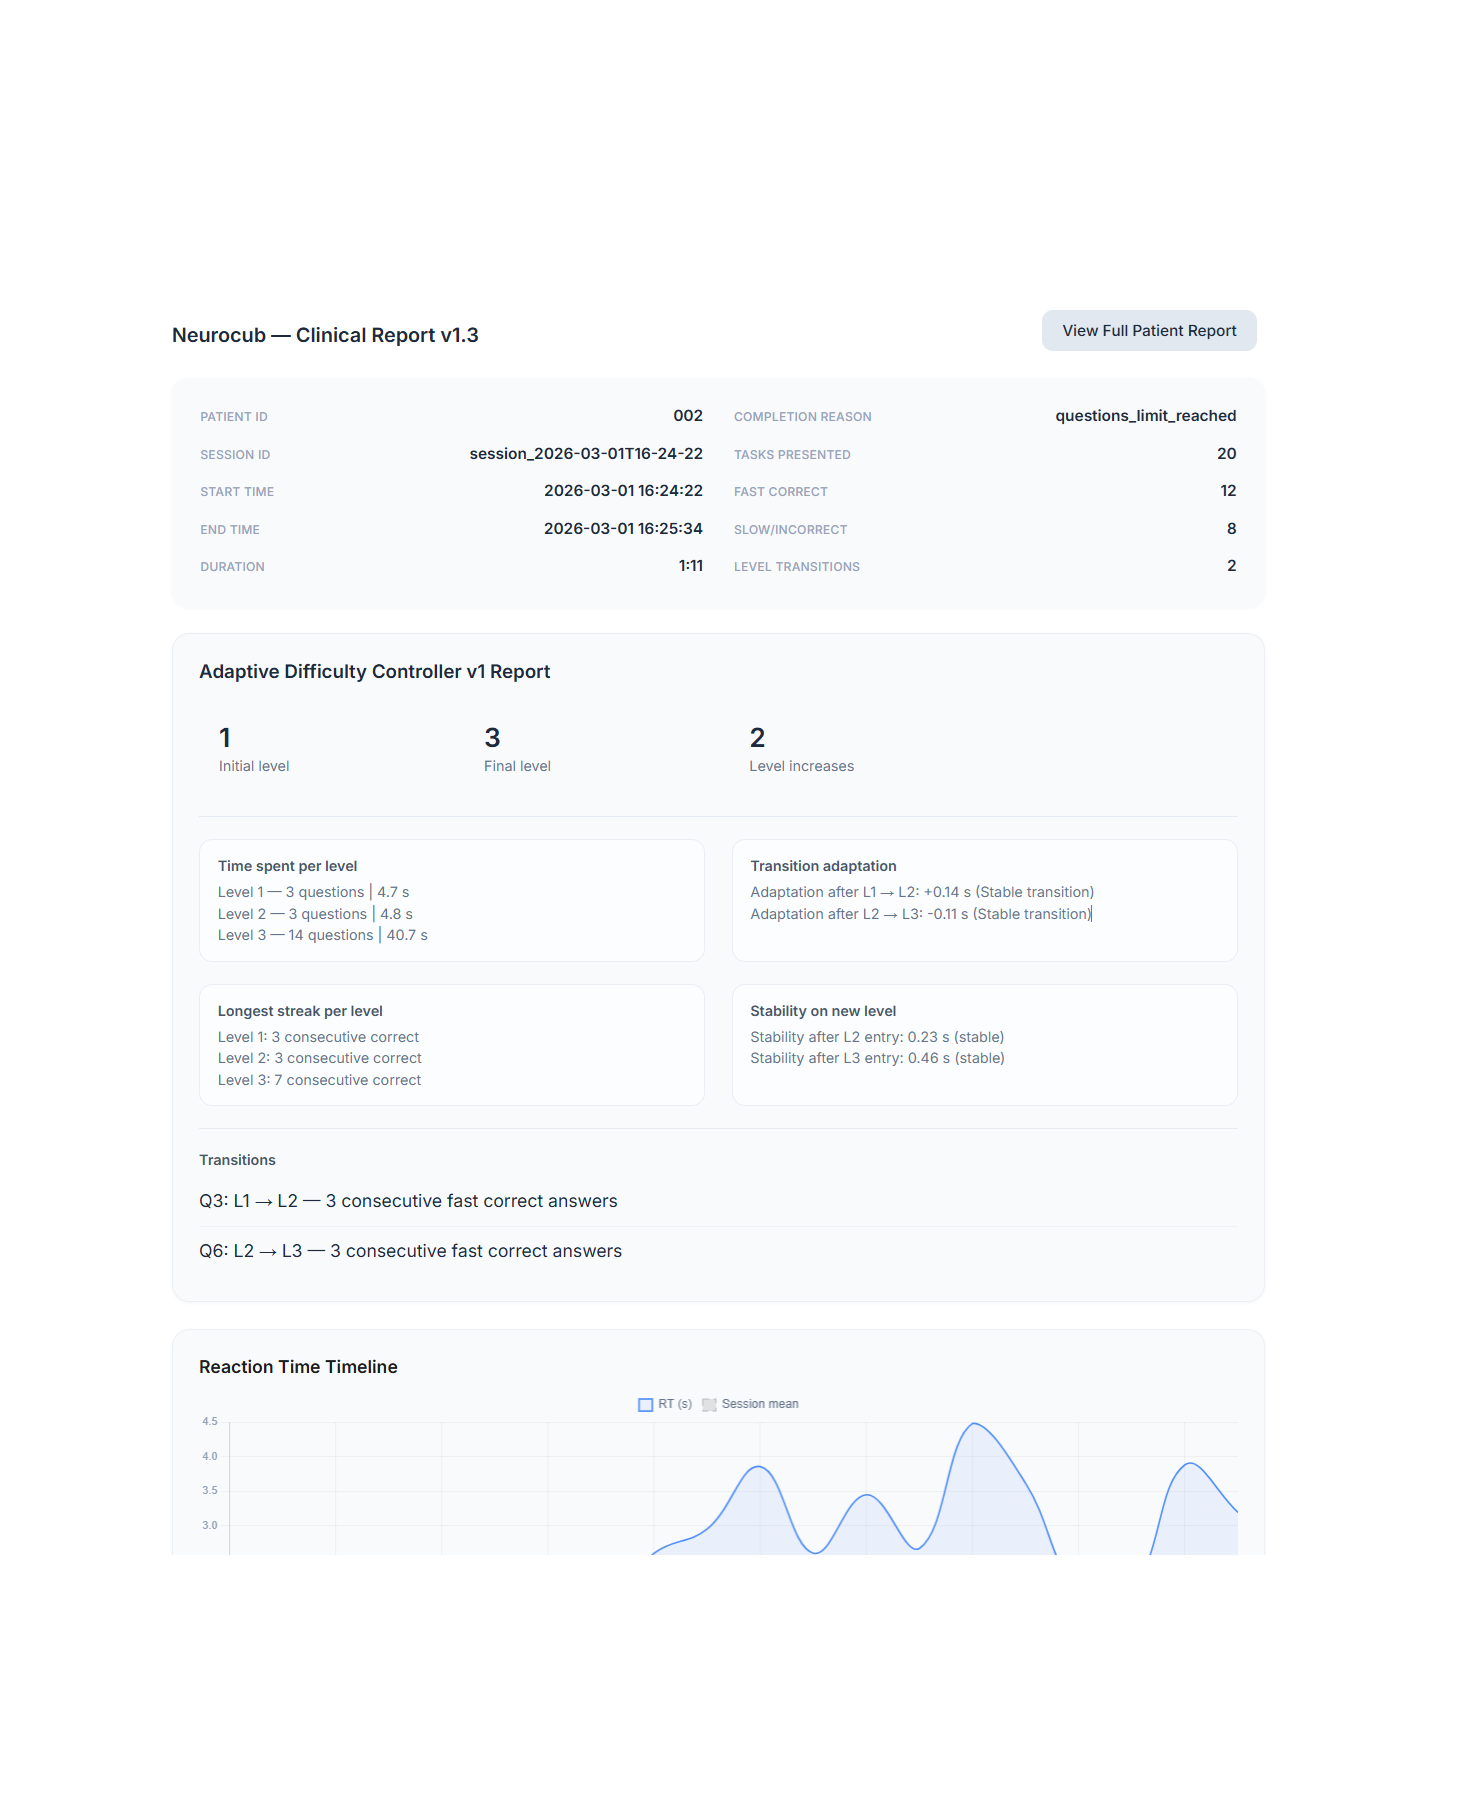
Every bedside session produces a complete event log, performance metrics, adaptive level transitions, and summarized outcome indicators. These elements are consolidated into a standardized clinical report that reflects not only task completion, but cognitive dynamics across the entire session.
Reports are calculated automatically from stored session data, ensuring objectivity, reproducibility, and longitudinal comparability. Clinicians receive a clear view of therapy intensity, engagement stability, reaction time trends, accuracy progression, and adaptive difficulty shifts — forming a continuously evolving clinical picture rather than isolated observations.
You can view a sample clinical session report in PDF format.
View a sample session report (PDF)
This report provides an extended, longitudinal clinical analysis of the patient’s cognitive trajectory, generated from multiple therapy sessions and aggregated session-level data.
Extended Multi-Session Clinical Report (PDF)
Within Dashboards & Reports, Neurocub is structured around four analytical layers:
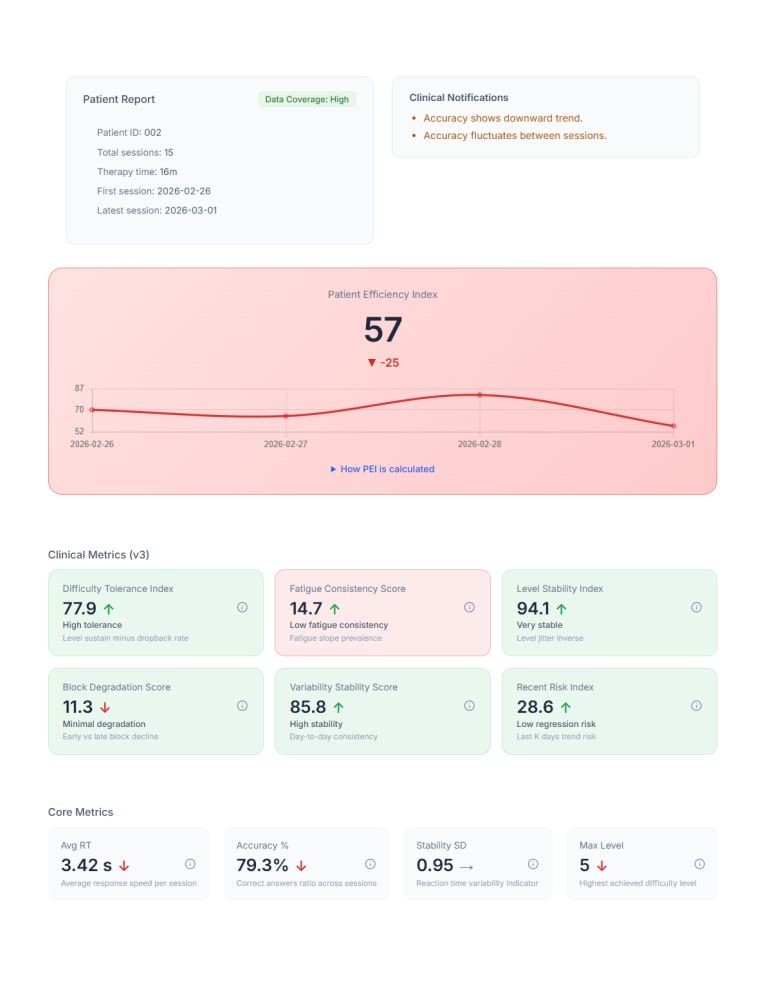
1. Session Overview Layer
Total sessions
Total therapy time
First session date
Latest session date
Baseline level
Current max level
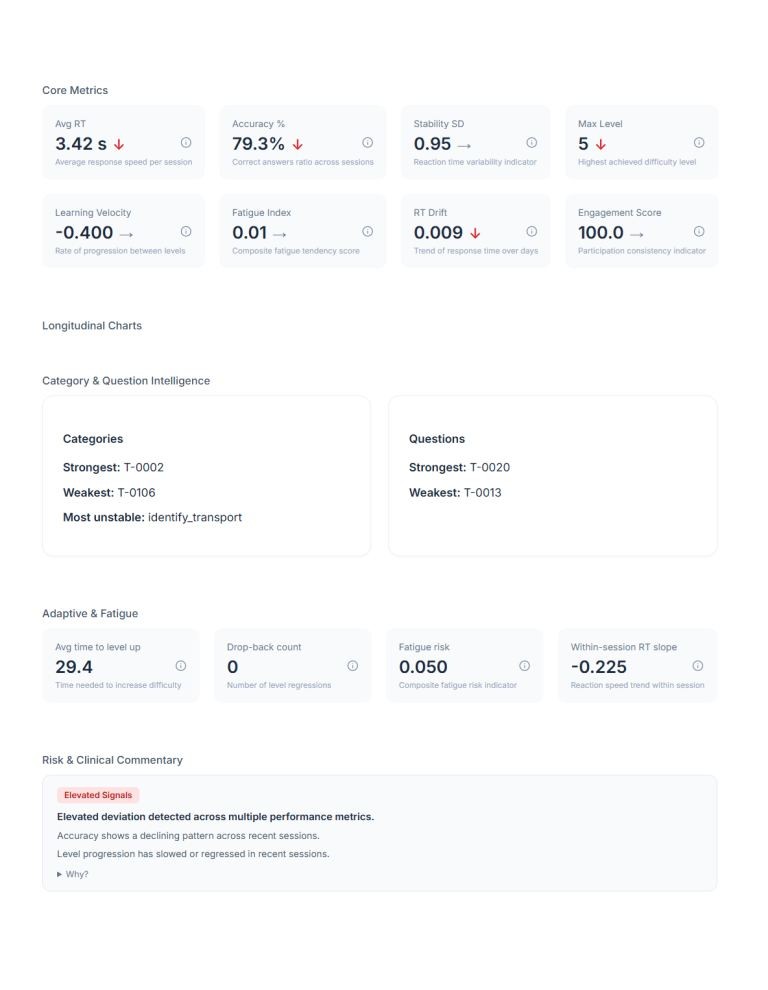
2. Clinical Status Metrics
Computed directly from session JSON logs:
Overall progression
Stability trend
Engagement pattern
Fatigue tendency
Variability index
Learning velocity
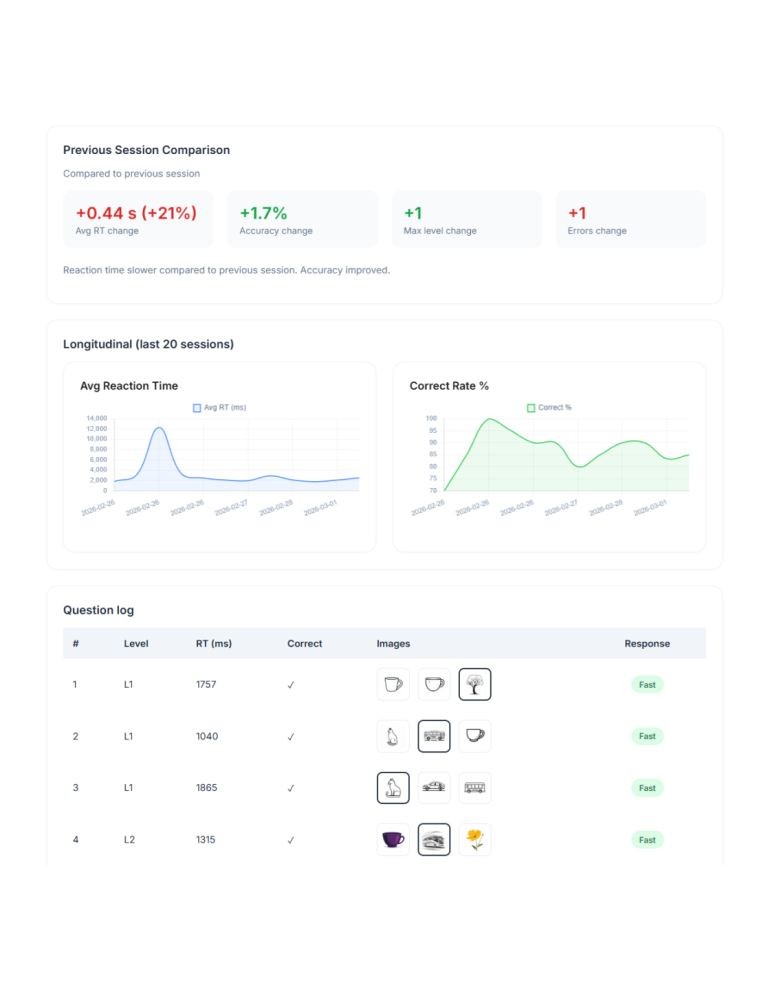
3. Longitudinal Trend Analytics
Full-width time-based graphs:
Average reaction time over time
Accuracy trend
Stability trajectory
Max level progression
4. Baseline vs Current Comparison
Baseline accuracy vs current
Baseline reaction time vs current
Level evolution
Adaptive shifts across sessions
What clinical teams receive
Clinics using Neurocub Dashboards & Reports receive a real-time analytics environment — not just visual charts, but structured recovery intelligence.
This includes:
• Live session monitoring dashboards
• Longitudinal cognitive trend analysis
• Fatigue and engagement pattern tracking
• Structured patient profile updates
• Automated session summaries and clinical flags
• Decision-support insights for next-session planning
Dashboards & Reports allow medical teams to observe daily progress, detect subtle changes, and maintain objective documentation of recovery dynamics.
Core purpose of Dashboards & Reports
Neurocub Dashboards & Reports exist to make cognitive recovery measurable, visible, and actionable:
• Transforming interaction data into structured clinical insight
• Highlighting trends instead of isolated task results
• Detecting fatigue and regression early
• Supporting therapists with objective analytics
• Creating a continuous recovery record instead of fragmented notes
This reporting framework ensures that every Neurocub session becomes a documented, analyzable clinical event rather than a standalone activity.
Neurocub It is a multi-layered therapeutic system designed to continuously interact with the patient, analyze neurological responses in real time, and dynamically build an adaptive cognitive recovery pathway.
Neurocub Therapy Architecture & Patient Interaction Model.
The structured data environment where session information is collected and organized. This includes interaction logs, response timing, accuracy markers, behavioral signals, and system events. This layer is responsible for transforming raw patient interaction into structured, reportable data streams.
A structured analytics engine consisting of cognitive metrics, performance indicators, engagement scores, fatigue markers, stability indexes, and longitudinal tracking parameters. Each metric belongs to a defined analytical category and contributes to a measurable recovery profile.
The analytical core of Dashboards & Reports. Here, the system processes live session data: timing trends, accuracy dynamics, hesitation patterns, engagement drops, recovery signals, and response stability. Every interaction is converted into structured analytical insight.
This layer builds longitudinal recovery trajectories in real time: performance trends, fatigue accumulation curves, attention stability patterns, and improvement vectors. Instead of isolated session results, clinicians see evolving cognitive dynamics.
Responsible for identifying clinically relevant changes. This includes regression alerts, fatigue thresholds, engagement decline markers, and significant improvement signals. The goal is early detection and informed intervention based on objective data.
The visualization layer for therapists and clinical teams. Here users access structured dashboards, comparative session views, cognitive trend graphs, performance summaries, and exportable reports. This transforms raw therapy data into clear, decision-support intelligence.
Session-Level Clinical Snapshot
Each therapy session generates a structured performance snapshot based on real-time interaction data. Clinicians can review reaction time dynamics, accuracy distribution, adaptive level transitions, engagement markers, and fatigue indicators within a single consolidated view.
Rather than reviewing raw logs, the dashboard presents clinically interpreted metrics that reflect cognitive load tolerance, response stability, and task execution efficiency.
Longitudinal Cognitive Trajectory
Neurocub dashboards provide multi-session trend visualization across defined time windows. Clinicians can observe:
• Reaction time evolution
• Accuracy stability curves
• Level progression patterns
• Variability index changes
• Fatigue threshold shifts
This longitudinal layer transforms isolated therapy sessions into a measurable cognitive trajectory.
Beyond reporting outcomes, Neurocub visualizes how the adaptive engine responds to the patient over time. The dashboard reflects:
• Difficulty escalation logic
• Regression protection triggers
• Engagement-driven adjustments
• Domain-specific strengthening
This allows clinicians to understand not only how the patient performs — but how the system strategically adjusts therapy delivery to optimize progression.
Why this structure is clinically important
Neurocub functions as a closed-loop therapeutic system, enabling capabilities that traditional rehabilitation tools typically cannot provide:
• Ongoing daily stimulation instead of isolated sessions
• Quantifiable performance trends instead of subjective impressions
• Dynamic therapeutic adjustment instead of static programs
• Integrated cognitive datasets instead of fragmented notes
Each session simultaneously fulfills three core functions:
• Therapeutic intervention
• Objective measurement
• Continuous model refinement
This integrated structure allows Neurocub to operate not as an add-on tool, but as a structured, intelligent rehabilitation environment.
